PTE Describe Image: Practice Tips, Templates, Examples
31 Jul 2023
The PTE Describe Image is an essential part of the PTE Academic exam that requires good observation and describing skills. Doing well in this section is critical to getting higher scores.
In today’s post, PTE Magic will help you explore useful tips and learn how to organize your responses well.
You’ll also understand how scoring works and prepare for the PTE Describe Image practice with sample templates to be more confident for the actual test.
Keep reading!
(Read our Vietnamese version here)
Key Takeaways
- The PTE Describe Image format assesses your ability to describe images typically with 6 questions encompassing various visual formats.
- The PTE describes image tasks and will be scored based on content, pronunciation, and oral fluency.
- See our detailed PTE Describe Image practice tips & examples for higher scores below.
Read more:
PTE Describe Image Format & Scoring Guide
Format
The PTE Describe Image format assesses your ability to describe images effectively. It is the third speaking item in the PTE Speaking section and typically includes 6 questions (6 images). They can be graphs, tables, maps, charts, diagrams, or photos.
You have 25 seconds to observe the image and gather basic ideas before describing it. After that, you will have 40 seconds to speak about what you see in the image.
The goal is to provide a clear and concise description without explaining features or hidden messages.
Related:
- PTE speaking tips for high scores
Scoring Guide
The PTE describe image task will be scored based on 3 criteria as below:
Content
This criterion is scored on a scale of 0 to 5. A high score (5) is awarded to answers that cover all relevant parts of the image, including their relationships.
The more elements from the image you describe accurately, the higher your score will be. Including around 12 items from the image in your response is enough to get the full score in the Content category.
Pronunciation
Pronunciation is also scored on a scale of 0 to 5, with 5 indicating native-like use of the language and 0 for unrecognizable English.
Clear and accurate pronunciation is essential to achieve a higher score in this category.
Oral Fluency
Like Pronunciation, Oral Fluency is also scored on a scale of 0 to 5. A score of 5 is given for smooth and natural speech without pauses or hesitations. Speaking fluently and confidently contributes to a better score in this aspect.
Related:
PTE Describe Image Practice Tips & Examples For Higher Scores
Bar/Line Graph
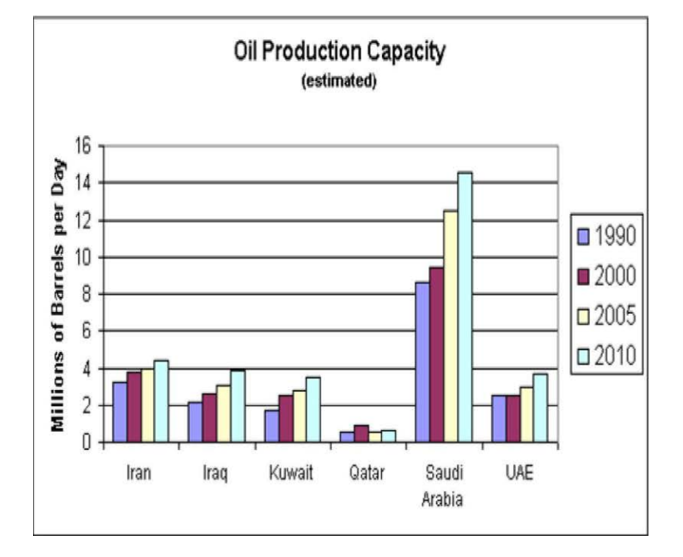
- Observe the axes and labels: Start by looking at the axes and labels of the graph to understand what variables are being measured.
- Identify key features: Look for key features in the graph, such as the highest and lowest points, significant trends, and any unusual patterns or outliers. Focus on the three main features to talk about in your response.
- Use comparisons: Compare the data between variables, periods, or categories. Highlight any significant differences or similarities you observe in the graph.
- Use numbers and specifics: Be precise in your description by using specific numbers and percentages from the graph.
- Organize your response: Structure your response with a clear introduction, main points, and a conclusion. Besides, PTE graphs practice also helps you become familiar with this pattern.
Table
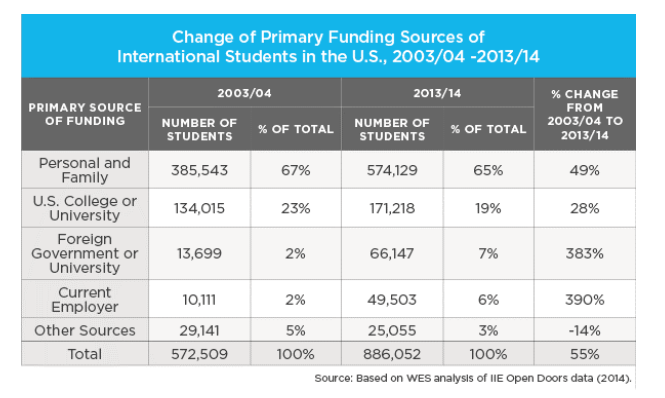
- Focus on title and variables: Pay attention to the table’s title and its categories to know what the table is talking about.
- Identify three key features: Quickly identify the three main points to discuss – the highest, the lowest, and one other noteworthy aspect.
- Be specific with numbers: Use specific numbers and percentages from the table chart PTE to provide accurate and precise information during your description.
- Link key features: Establish connections or relationships between your identified three elements. This adds coherence and flow to your response.
- Provide context: Briefly mention the year or period in the table to set the context for your description.
Map
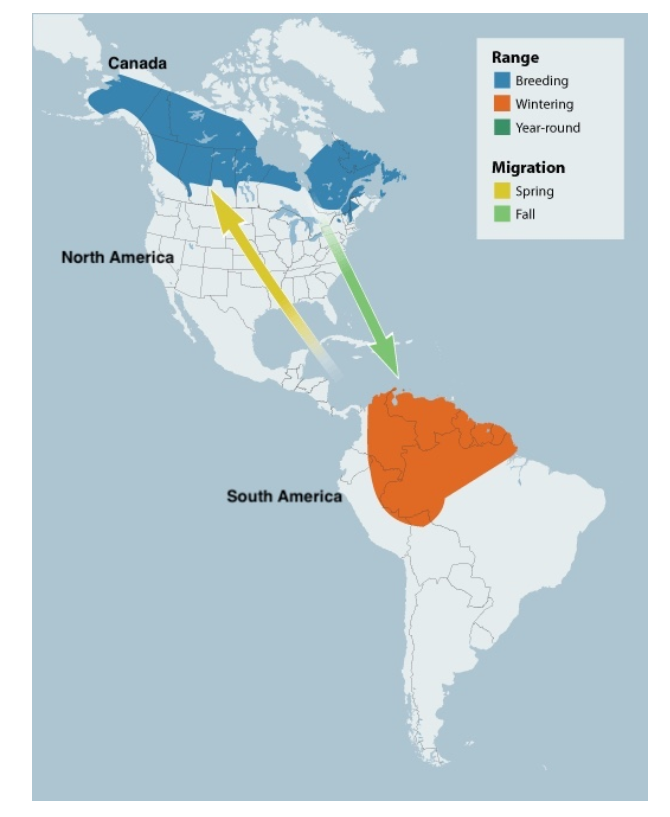
- Focus on key elements: Identify the essential features of the map, such as geographical locations, landmarks, or changes over time. Pay attention to details that stand out and would be relevant to your description.
- Use directional language: When describing movements or locations on the map, use directional language like “north,” “south,” “east,” and “west” to provide clear and concise information.
- Highlight changes and patterns: If the map chart PTE shows changes over time or specific patterns, be sure to point them out in your response. This demonstrates your ability to analyze data and draw conclusions from the map.
- Use comparisons: Compare different areas or aspects shown on the map to provide a more comprehensive description. This can include comparing population sizes, geographical features, or any other relevant data.
Pie Chart/ Flow Chart
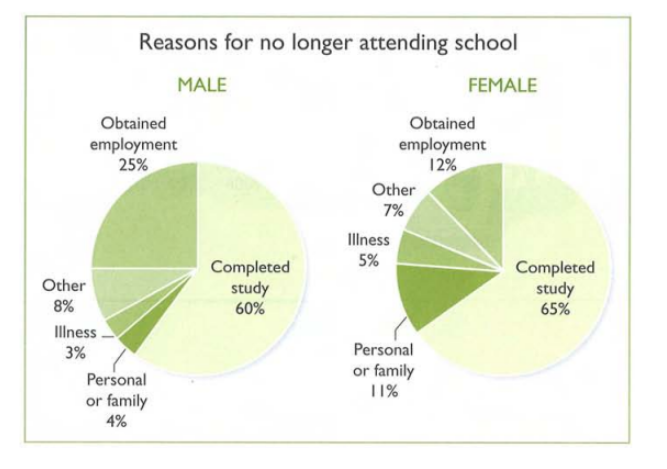
- Understand the process chart PTE: Grasp the overall process or sequence shown in the flow chart. Pay attention to the start and end points and the direction of the flow.
- Identify key steps: Focus on the major steps or stages in the flow chart. Mention them clearly and sequentially.
- Use linking language: Use appropriate linking words to connect the steps logically.
- Highlight progression: Describe how the process progresses from one step to another. Mention any decision points or outcomes along the way.
- Visualize the flow: This is one of the most useful Describe Image PTE tips to guide your description smoothly. It will help you stay on track and avoid missing any crucial points.
Venn Diagram
- Identify logical sets: Mention the different logical sets or categories represented by the circles in the Venn diagram. This helps the listener understand the context of the diagram.
- Focus on overlapping areas: Highlight the regions where the circles overlap, indicating common components shared by the sets. Describe the intersections and their significance.
- Detail unique characteristics: Explain each set’s unique qualities or elements that do not overlap with the others. Provide specific information to differentiate between the sets.
- Use comparative language: Use words like “while,” “whereas,” or “on the other hand” to compare the different sets and their features.
- Summarize overall overlaps: Conclude your description by summarizing the overall overlaps and shared characteristics among the sets. Emphasize the key points.
Photo
- Observe: Take a moment to observe the photo carefully during the 25-second preparation time. Keep your eyes on key elements, people, objects, and the overall scene.
- Identify three main points: Quickly choose three main points or features in the photo that you can confidently describe in English. Focus on familiar elements, such as colors, objects, or actions.
- Create a story: Organize your description logically and coherently. You can create a mini-story by connecting your identified three main points.
- Avoid over-explanation: Stick to the main points and do not overload your response with unnecessary details. Be concise and focused.
PTE Describe Image Templates
Bar/Line Graph Template:
Introduction: The graph illustrates the trends in [subject] over [period].
Body: The [subject] shows a significant increase from [start year] to [end year], reaching its peak at [highest point]. Conversely, there was a noticeable decline from [highest point] to [lowest point]. The data also shows a moderate fluctuation between [year] and [year].
Conclusion: Overall, the graph demonstrates the changing patterns of [subject] over the given time frame.
Table Template:
Introduction: The table presents data related to [topic].
Body: [Category 1] witnessed a substantial rise from [value] in [year] to [value] in [year]. In contrast, [Category 2] had a gradual decrease from [value] in [year] to [value] in [year]. [Category 3] remained relatively stable throughout the period, hovering around [value].
Conclusion: In summary, the table highlights the various trends and figures for [topic].
Map Template:
Introduction: The map displays [location or theme].
Body: [Region 1] is prominently indicated on the map, showcasing its significance in [context]. Similarly, [Region 2] is notable for its [feature]. Additionally, [Region 3] stands out due to its [characteristic].
Conclusion: The map offers valuable insights into [location or theme] and its notable features.
Pie Chart/Flow Chart Template:
Introduction: The pie chart illustrates the distribution of [category] in [context].
Body: The largest portion of the pie chart is attributed to [category 1], constituting [percentage]. Meanwhile, [category 2] and [category 3] represent [percentage] and [percentage] of the chart, respectively.
Conclusion: In conclusion, the pie chart provides a clear overview of the distribution of [category] in [context].
Venn Diagram Template:
Introduction: The Venn diagram compares and contrasts [topic 1] and [topic 2].
Body: While [topic 1] is characterized by [feature 1], [topic 2] is known for [feature 2]. On the other hand, both [topic 1] and [topic 2] share [common features].
Conclusion: Overall, the diagram highlights the unique attributes and shared elements of [topic 1] and [topic 2].
Photo Template:
Introduction: The photo captures a scene of [description].
Body: The foreground of the photo features [main objects/people] engaging in [activity]. In the background, [additional details] can be observed, contributing to the overall atmosphere.
Conclusion: Overall, the photo vividly depicts [description], capturing the moment’s essence.
What Not To Do In The PTE Describe Image Section
- Overdescribing: How you speak is important in the PTE Describe Image task, not just describing what you see. Many test-takers assume that the content is everything, so they think that adding more details means higher scores. However, pronunciation and fluency also matter. The scoring system cannot assess your answer without these. Therefore, even a detailed answer will have a low score if pronunciation is unclear.
- Over-explaining: This is another common mistake. Some candidates might feel pressured to cover every detail, especially for informative images. This approach can backfire because trying to include too much information often leads to rushed speech. Additionally, your answer will lose fluency and run out of time before finishing. The key is to focus on the most significant aspects. A well-structured answer should start with an overview, then highlight key points, and end with a summary.
- Speaking too little: This happens when test-takers struggle to answer under pressure. These candidates often hesitate, pause a lot, or give incomplete descriptions instead of forming a clear answer. A good answer is well-structured and needs a lot of practice.
- Lacking preparation: The image type in this task can be complex. You may encounter charts, graphs, or maps, which are images that include lots of information. Candidates may be unsure about where to start if they lack practice. Additionally, those who are unfamiliar with the task tend to rush with only 40 seconds to answer.
- Underestimating the task: This is a costly mistake. Some think this task is easy because it has pictures. However, scoring high on the PTE Describe Image task is difficult without a strategy and structured practice.
Frequently Asked Questions
How Should I Practice?
Achieving a high score in the Describe Image task requires structure, clarity, and fluency. Focus on the key details and organize your response logically. Additionally, using the right vocabulary can sharpen your answer. A steady, natural flow ensures clarity, so practice your pacing.
How Long Should I Speak?
You should speak for thirty to forty seconds. This gives you enough time to highlight key points without rushing or running out of words. A short answer may lack depth, while a long answer risks losing clarity.
Does Content Matter In The PTE Describe Image Section?
Yes, but it’s only one part of the score. The task assesses pronunciation, fluency, and content. Describing an image won’t get you a high score if you sound hesitant or unclear. The best approach is to structure your response. Start by giving an overview, then highlight key trends, and conclude with a summary.
How Do I Improve?
Expand your vocabulary to describe images more precisely. Speaking out loud and recording yourself also helps you recognize your weak areas. The more you practice, the higher you will score.
How Many Describe Image Questions Are There?
You’ll encounter six questions typically. Each will present a different type of visual, including graphs, charts, tables, diagrams, maps, or photographs.
Conclusion
To sum up, the PTE Describe Image task tests how well you can discuss pictures like graphs, charts, maps, and photos.
Doing well means spotting important details, arranging your thoughts, and speaking clearly and smoothly. By practicing regularly, using helpful examples and templates, and improving your English skills, you can do better in this part of the PTE test.

Moni Vuong
PTE Magic
My name is Moni, and I am a seasoned PTE teacher with over 6 years of experience. I have helped thousands of students overcome their struggles and achieve their desired scores. My passion for teaching and dedication to my student’s success drives me to continually improve my teaching methods and provide the best possible support. Join me on this journey toward PTE success!
Related Blog

28 Jan 2026
How To Study In New Zealand As An International Student

28 Jan 2026
How To Find A Job In New Zealand As An International Student

28 Jan 2026
New Zealand Accommodation Guide for International Students
Frequently Asked Questions
What’s the difference between PTE Academic and PTE Core?
What is PTE Exam Structure and Duration?
How is PTE exam scored?
What tasks are included in PTE Academic?
What tasks are included in PTE Core?
How long is the score valid?
Where can I book PTE Academic and PTE Core exams?
How much does the PTE exam cost?
How can I prepare for the PTE Exam?
Subscribe to our newsletter.

PTE Magic Practice Platform is an AI-powered PTE test prep platform that helps you achieve your desired score with exam-like questions, instant AI scoring, and personalised feedback. Achieve your best PTE score with targeted practice and proven strategies.